FGT think your best choice in the future
System Integration Designers in FGT
- Description
- Additional information
- Technical Specifications
- Application field
- standard specification
- meet design standards
- Special needs
- Inquire now
E-Power Monitoring Solutions
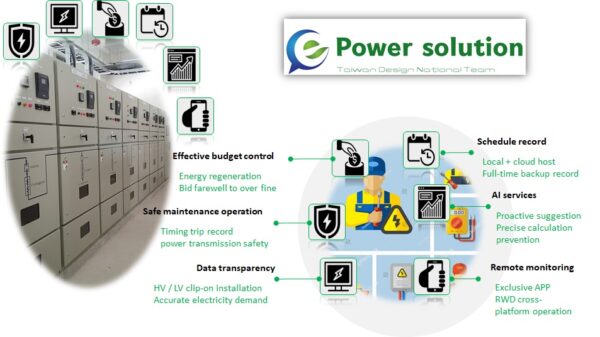
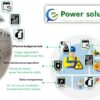
Solution function
- Transparency of the whole power system: ensuring the stability of the coverage of high-voltage to low-voltage power consumption
- AIoT Solutions: Easy Installation for Maintenance and Cost Reduction
- Renewable Energy Systems: Scalable Development Options for Energy Savings and Cost Reduction
- Cloud system enhancements: support for AI simulations for forecasting and data analysis
- RWD Cross-Platform: Customized Flexible Operation Scenarios for Various Industry Applications
Monitoring interface technology solution
- HV high voltage power consumption scheme
- Trend chart of electrical equipment
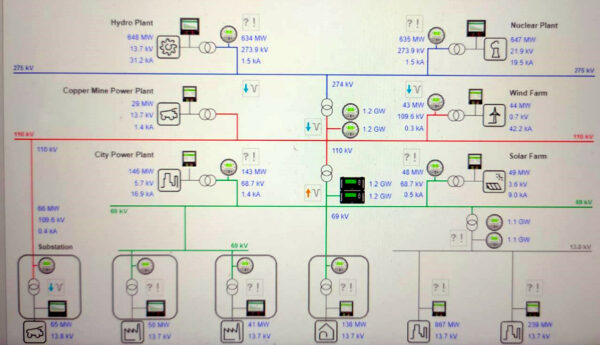
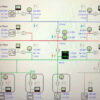
- Monitoring diagram
- LV Low Voltage Electricity Single Line Diagram
- Billing Control
High Voltage Technology Solutions
- Instant Occurrence vs. Instant Occurrence Point — 1 ms
- Instant record of extreme events. Reduce risk.
- Network-based SOE module: real-time understanding of tripping status
Helping you with power solutions - System status remains stable
AIoT low voltage technology solutions
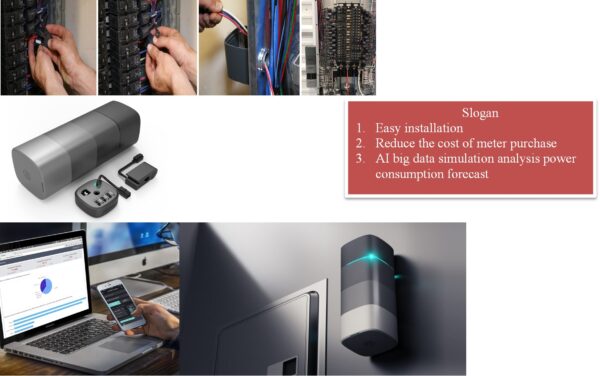
- Easy installation
- AI Big Data Analysis Simulation
- Intuitive system report presentation
- Power consumption smart warning
- Lag-free real-time monitoring
- Detailed energy data analysis
- HVAC advanced automatic control
Renewable Energy Technology Solutions
- Peak and off-peak electricity scheduling
- contract capacity suppression
- emergency power backup
- Demand Response Engagement
Cloud-based power monitoring SCADA and E-power management system EPMS
Facility management is transitioning from wanting on-premise applications to cloud-based power monitoring SCADA or E-Power Management EPMS monitoring solutions. Why the sudden abandonment of native apps?
- Cloud-based power monitoring Power SCADA is more cost-effective (requires minimal hardware)
- Cloud-based power monitoring Power SCADA reduces maintenance hassles for on-site computers (maintenance hardware, updates, disaster recovery)
- Cloud-based power monitoring Power SCADA supports highly distributed architecture
- You can view the power monitoring Power SCADA (mobile phone monitoring) in the cloud anytime, anywhere
Overall, cloud power monitoring itself is more acceptable in the business
Using a cloud-based power monitoring application, facilities can continue to use Power SCADA or EPMS solutions through the cloud. Clearly, local devices such as meters are still needed to capture data, as well as a mechanism to convert local information into a hosted power monitoring Power SCADA solution. However, the cloud removes many of the methods that spur typical monitoring solutions.
Managed service providers such as system integrators realize the benefits of these solutions. They have started hosting power monitoring Power SCADA and EPMS software on behalf of clients. The integration is largely complete after a simple power harvesting meter was installed on site at the factory.
Even if they do not have an on-site computing processor hosting the Power SCADA solution for power monitoring, facility owners and managers can still access the web version of the solution to view their data online. Meters store data locally, sync to the cloud, and update power monitoring Power SCADA or EPMS data.
All in all, this is a great way to save costs while still providing a comprehensive solution for evolving stakeholders.
Renewed focus on power quality
Interference direction detection has brought new interest in electrical quality. It guides the owner to find the cause of electrical disturbance anywhere (upstream or downstream). This trend has even led to some hardware updates to meters, such as the Schneider Electric ION 75XX/76XX power quality analysis meters, to enable interference direction detection.
Adding an energy meter with disturbance direction detection to an electricity service entry node allows owners to determine not only when a voltage or power interruption has occurred, but also its source. This gives them an edge in determining who to have a conversation with. to learn about their utility or electrical maintenance department application.
As the grid continues to add non-stationary decentralized generation and the installation of energy efficiency technologies continues to expand, we are seeing a re-emergence of power quality related events. Grid outages and ubiquitous solutions that cause not only power quality but poor power quality (eg VFDs, LED lighting) give owners a better understanding of power quality within a facility.
A few years ago, many industrial facilities quickly retrofitted rooftop searchlights with LEDs with high failure rates. This is due to the failure to identify voltage fluctuations and harmonic issues that exist within the facility. This was a painful lesson for manufacturers as well as early adopters of roof search LED lighting. While I'm sure the warranty cost is huge for the OEM, the owner pays for the labor to fix the failed product.
I see a future where some of the specifications for certain types of products will include specifications for power quality, just like operating temperature and humidity. When this happens, owners will need tools to assess their power quality.
Advanced features such as disturbance direction detection and simple power quality analysis meters such as Schneider Electric's PQ performance modules will go a long way in demystifying power quality for most industrial and mission critical facility owners. .
More features specific to built-in cloud applications
There is an app for this. "One of the trends is the emergence of niche applications or add-on modules that can meet specific needs in vertical markets. This helps reduce the need for complex and often costly customization of control systems.
For example, Iconics offers very specific mods that allow you to manage assets or build dashboards, analyze alerts or track energy. Another good example is Schneider Electric's Power Monitoring Expert (PME). Include other mods in the PME, such as generator performance mods, UPS performance mods, and power quality performance mods, to name a few. Customers can select modules for their facilities and extract further insights to help them save man hours, identify equipment issues or reduce expenses.
These add-on mods do more than just repackage information. They'll delve deeper into your information profile and provide insights to help reduce costs and risk.
The coolest thing about niche apps is that they work with your existing investments even if they were developed by other solution providers. We're already in OEE, failure detection,
Smart Collective Electricity Meter Power Meter
Smart collective meters are tools for managing and recording the power and performance of home electronic devices. What makes electricity meters "smart" is their ability to provide detailed and accurate analysis of electricity usage in real-time or at predetermined intervals, without the need for a technician.
The U.S. Department of Energy estimates that nearly 70 million U.S. households already have smart meters, and utilities have gone to great lengths to replace analog meters (read manually every month).
The strategic potential for collecting extensive information on electricity usage includes the value of fast, accurate measurements and the elimination of monthly estimates and meter reading home visits.
Although this is the most energy-efficient and profitable way to manage the grid, the personal data that smart collective meters are collecting in real time remains a concern, including unnecessary information about hourly electricity usage. This data collection may violate the privacy of users.
Here are the benefits and challenges that smart centralized meters bring to utilities, customers and the environment:
Advantages of Consumer Smart Integrated Meters
- More, more detailed feedback on energy usage
- Ability to adjust habits to reduce electricity bills
- Reduce the number of outages and system-wide power failures
Disadvantages of Consumer-Oriented Smart Aggregate Meters
- Additional costs for installing new meters
- Privacy concerns of personal data collected and how it is used
- Consumers take more responsibility for maintenance
Advantages of smart collective meters in power companies
- Reduced monthly manual meter readings
- Instant monitoring of electrical systems
- Encourage more efficient use of electricity resources
- Provides response data to balance electrical loads while reducing outages
- Enable dynamic pricing
- Capital expenditures for building new power plants are avoided
- Leverage existing resources to help optimize profits
Disadvantages of smart centralized meters for power companies
- Additional costs for training individuals, developing equipment, and implementing new data storage processes
- Manage public reaction and feedback on new meters
- Long-term financial commitment to new hardware/software
- Ensuring the security and privacy of metering data
Disadvantage is short term
New technologies that conserve resources bring new challenges related to expensive energy-intensive data storage and privacy concerns that are particularly acute in these home and commercial technologies. If consumers are unfamiliar with self-managing new energy systems, they are less likely to pay close attention to the energy-saving potential of such smart centralized meters (or how their personal data is used).
Most of the shortcomings of smart centralized meters appear to be short-term, but in some cases, especially in rural and currently off-grid areas, such challenges will slow the adoption of these technologies.
A commitment to protecting and valuing users’ personal data is critical, but it won’t work if power companies don’t incorporate cybersecurity and technology leadership directly into their bylaws. Consumer protection is critical to the product, and responsive features make it useful for utility companies.
| Application | Equipment |
|---|---|
| Types of | Electronic |
| Installation method | Panel Mounting |
| Output method | Digital signal |
| Platform | HMI, PC+APP |
| Application | building, factory |
| Types of | central monitoring, control panel, cloud |
Technical Specifications
E-Power Solutions
Solution function
- Transparency of the whole power system: ensuring the stability of the coverage of high-voltage to low-voltage power consumption
- AIoT Solutions: Easy Installation for Maintenance and Cost Reduction
- Renewable Energy Systems: Scalable Development Options for Energy Savings and Cost Reduction
- Cloud system enhancements: support for AI simulations for forecasting and data analysis
- RWD Cross-Platform: Customized Flexible Operation Scenarios for Various Industry Applications
Monitoring interface technology solution
- HV high voltage power consumption scheme
- Trend chart of electrical equipment
- Whole plant monitoring map
- LV Low Voltage Electricity Single Line Diagram
- Billing Control
High-voltage power technology solution
- Instant occurrence and instant occurrence point - 1ms
- Instant record of extreme events. Reduce risk.
- Network-based SOE module: real-time understanding of tripping status
- Helping you with power solutions
- System status remains stable
AIoT low voltage technology solutions
- Easy installation
- AI Big Data Analysis Simulation
- Intuitive system report presentation
- Power consumption smart warning
- Lag-free real-time monitoring
- Detailed energy data analysis
- HVAC advanced automatic control
Renewable energy technology solutions
- Peak and off-peak electricity scheduling
- contract capacity suppression
- emergency power backup
- Demand Response Engagement
Application field
Electricity Demand Management and Response
Demand side management means reducing the amount of electricity a building uses (demand) at certain times of the day. Demand charges can account for 30-50% of your monthly electricity bill, so controlling demand can save you a lot of money. For example, while your base kWh rate is $ 0.10, the highest 15 minute usage might be $ 20.00/kW!
There are times when you have to pay high fees:*
- Maximum kilowatt interval for the month (maximum demand electricity)
- Maximum kW interval during peak hours (peak demand power)
- Hot summer, additional "peak event" fees
*Demand charges vary by utility provider
Leverage your energy data for you
- Maximum kilowatt interval for the month (maximum demand electricity)
- Maximum kW interval during peak hours (peak demand electricity)
- Hot summer, additional "peak event" fees
*Demand charges vary by utility provider
lost energy efficiency
You cannot change what is not measured. How do you know your energy retrofit and upgrade project is on track? FGT is measured at the circuit level in addition to the power supply, so we can tell you exactly how much energy is saved by each component.
- Compare a building's energy end use (lighting, HVAC, etc.) to national CBECS standards
- Efficiency upgrades for measurement and verification programs, such as VFDs or LEDs
- Identify motor problems that may be consuming too much energy
Why focus on improving operations?
For many plant managers, the day-to-day demands of the job cannot be easily defined. Aside from saying you keep saving a bunch of problems:
- Broken equipment – find out what's not working, why and fix it
- Unplanned Plan – Someone on the employee mistakenly changed the BMS plan
- Undiagnosable problems – you learn about problems in your building from residents, not employees
- Today's process is laborious: daily drills to inspect equipment and preventive maintenance schedules to guess when failures might occur.
Today's processes often rely on complaints. You don't have to wait for occupants to tell you about building problems.
Your building needs a 24/7 attendant.
standard specification
If you need a written word file, please read it in the letter
meet design standards
